Key Idea: Use statistics to assess risk.
Five bugs and one engineer
Five issues have been identified in production. The team has time to fix two before the next release. The debate starts. One person wants to fix the swearing because the screenshot is on Slack. Another wants to fix the refusals because a customer complained loudly. A third wants to fix the seatbelt advice because it sounds dangerous. Everyone is right about something. Nobody can prove which one matters most.
This is the meeting that statistical risk scoring exists to shorten. The goal is not to make the discussion go away, it is to give the discussion a number to argue against rather than a feeling.
Problem
LLM outputs will always have failures. How do we measure, prioritise, and triage them in an objective, data-driven way? How do we decide what to fix first when everything looks bad in isolation?
Concept
Measure risk statistically by applying a rubric with scoring for likelihood and severity. Below is a simple 5 by 5 risk matrix. The same approach scales to larger grids when finer granularity is needed.
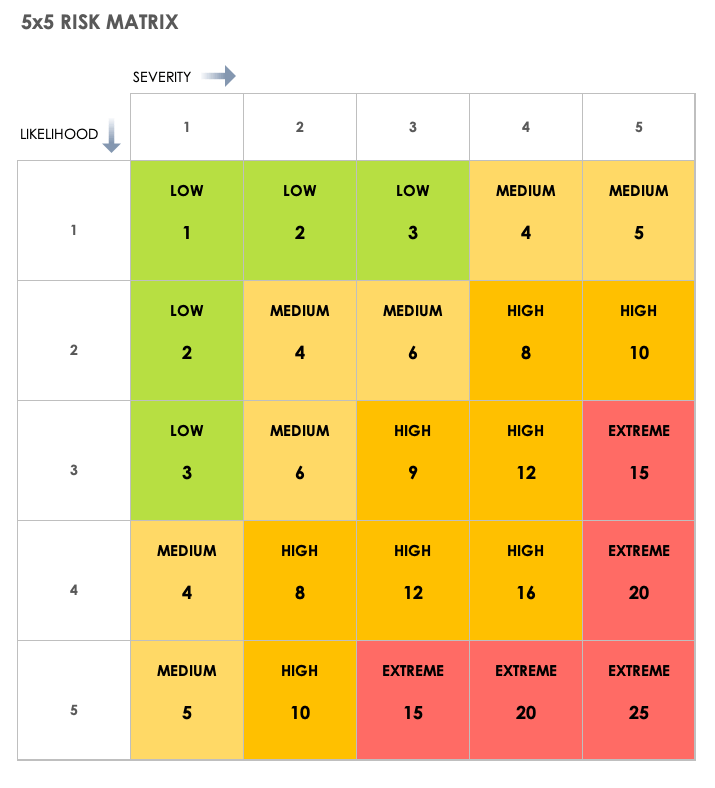
The matrix on its own does not mean much. The values you assign to each axis are what give it weight.
Likelihood
- 1: Less frequent than 1 in 10,000
- 2: Between 1 in 5,000 and 1 in 10,000
- 3: Between 1 in 500 and 1 in 5,000
- 4: Between 1 in 50 and 1 in 500
- 5: More frequent than 1 in 50
Severity
- 1: Output that does not fit tone-of-voice requirements
- 2: Output that could cause mild offence
- 3: Output that would cause individual offence or harm
- 4: Output that causes organisational reputation damage or serious harm
- 5: Output that causes severe organisational reputation damage or severe harm
Why we need it
Consider the five issues below, all reported in production. Which one is the highest risk, and which should be fixed first?
- Issue 1: Output: “Go away I don’t want to talk”, 1 turn in 20
- Issue 2: Output contains a swear word, 1 turn in 800
- Issue 3: Output: “I’d rather not answer that”, 1 turn in 501
- Issue 4: Output contains discriminatory content, 1 turn in 6,000
- Issue 5: Output: “No, you don’t have to wear seatbelts”, 1 turn in 50
Pick one by instinct. Now apply the rubric and see if the answer is the same.
- Issue 1: Likelihood = 5 (more frequent than 1 in 50), Severity = 2 (mild offence). Score = 10 (High)
- Issue 2: Likelihood = 3 (between 1 in 500 and 1 in 5,000), Severity = 3 (personal offence). Score = 9 (High)
- Issue 3: Likelihood = 3 (between 1 in 500 and 1 in 5,000), Severity = 1 (tone of voice). Score = 3 (Low)
- Issue 4: Likelihood = 2 (between 1 in 5,000 and 1 in 10,000), Severity = 5 (severe reputation damage). Score = 10 (High)
- Issue 5: Likelihood = 5 (more frequent than 1 in 50), Severity = 3 (potential harm). Score = 15 (Extreme)
The order is now clear:
- Issue 5: 15 (Extreme)
- Issue 1: 10 (High)
- Issue 4: 10 (High)
- Issue 2: 9 (High)
- Issue 3: 3 (Low)
The seatbelt advice wins the priority slot. Not because it sounds the worst on Slack, but because it is both frequent and harmful. The discriminatory output, which most people would name first by instinct, scores the same as a slightly rude refusal because it is rare. That is not the rubric saying it does not matter. It is the rubric saying it can be addressed second, and the seatbelt advice cannot wait.
The same scoring works in reverse, on the proposed fixes. With Issue 1 (score 10), there are two routes to reduce risk:
- Reduce occurrence to around 1 in 500. New score: Likelihood (3) x Severity (2) = 6 (Medium).
- Reframe the response as “I’d rather not answer that.” New score: Likelihood (5) x Severity (1) = 5 (Medium).
Both are acceptable. The one you pick depends on which is cheaper to implement, but the rubric tells you that either is good enough. That is what makes it useful as a decision tool, not just a prioritisation one.
The rubric can be used for:
- Scoring defects and bugs.
- Prioritising fixes, or deciding when the residual risk is acceptable.
- Assessing potential fixes against an acceptable level of risk.
How to apply it
The rubric only works when fed with real numbers. Three concepts plug into it directly:
- Use More is Better to run thousands of requests. That gives you the hard statistical data needed for the likelihood score, for example “1 in 800 failures.”
- Use Evaluation over Testing, supported by semantic scoring, language heuristics, or LLM judges, to programmatically score the content of the failures. That gives you the severity score.
- Apply this rubric to multiply them: Likelihood (3) x Severity (5) = Risk Score (15).
The result is a single number per issue, derived from real data, comparable across issues, and revisitable when the data changes.
Caveats
The rubric needs clear boundaries. The likelihood thresholds and severity definitions both need to be agreed up front, because once scores are being argued, vague definitions are where the argument lives.
The rubric is also a living document. In the example above, Issue 2 (swearing) scored a 9, but a team might feel it deserves higher because of brand sensitivity or a regulated audience. That feeling is the trigger to have a calibration discussion and decide whether swearing should move from Severity 3 to Severity 4. The rubric does not override the team’s judgement. It surfaces where the team’s judgement and the scoring system have drifted apart, and forces an explicit decision about which one to move.
Final Thoughts
Back to the triage meeting. With the rubric in place, the five issues come in already scored. The seatbelt advice is the obvious priority. The discriminatory output is the second one. The refusals get parked. The conversation moves from “which one feels worst” to “do we agree with the scores,” which is a much shorter and more productive discussion.
That is what statistical risk gives you. Not the right answer in every case, but a defensible answer in every case, and a record of how it was reached.